Marine Traffic
Here you can see the correlation between the terminals and the vessels for selected date and time.
On the top left you can select the desired time period. In the table below is a list of data for the selected time period.
The table has columns Timestamp and Vessel count (number of vessels in the area at that time).
With a click on the table row all terminal markers and vessel markers for selected Timestamp will be shown on the map.

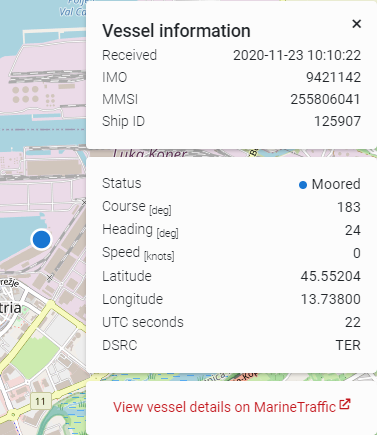
Vessel marker
There are two types of vessel markers. Circle markers designate the vessel is stationary and the boat marker tells us the vessel is moving.
There are also 15 possible statuses which are indicated with different colors.
With a click on vessel marker the vessel information preview opens in the top-right.
Here you can see every piece of information for selected vessel. If you hover on any of these information a tooltip with short description is shown. On the bottom of this vessel preview is a link which leads to official Marine Traffic website with more information regarding the selected vessel.
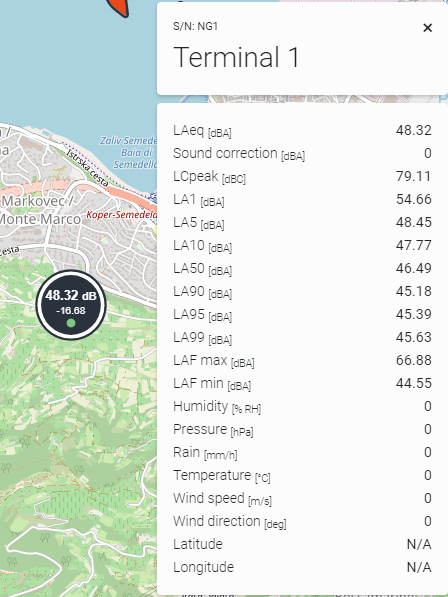
Terminal marker
The terminal marker displays LAeq [dB] and threshold with color indication for selected time.
With a click on terminal marker the terminal preview opens in the top-right.
Here you can see all terminal parameters that are enabled in Dataview settings.
If you click on the same terminal marker again once selected, that will redirect you to Dataviewer with selected terminal and time. This works both ways.