Data Viewer
To access Data viewer click Data viewer in the main menu. It enables the viewing of noise data and other parameters (wind and/or rain can be shown if the optional weather station is used).
At the left is a list of terminals. If there is more than one terminal you can select the desired terminal by clicking it. Selected terminal is highlighted. Terminals that are offline have a red left border.
You can choose between three views: Month, Day and Hour. Hour view is selected by default.
⚠ To navigate between Month, Day and Hour views use buttons Month, Day and Hour. If you use browser’s back navigation, you’ll actually leave Data Viewer and return to the previous page, e.g. Terminals.
Month View
To open Month view click on Month. Data for the month selected in the date field is shown. To select a date click on the date field: a calendar opens. At the top there are some shortcuts for date ranges: THIS WEEK, LAST WEEK, LAST 2 WEEKS, LAST 3 WEEKS, THIS MONTH. To navigate between the months click on the arrows to the left and right of the month. To select a date range click on any two days that are at most a month apart. If data for the selected date range exists, it is shown in the table below.

⚠ If no data is shown, it means that there is no data for the selected month on the Noise Guard server. The obvious reason for this would be that a month before the beginning of monitoring is selected or a month in the future is selected. If you expected to see data, but it is not shown, another reason could be that the terminal doesn’t have a reliable connection to the server. In that case the data is stored locally on the terminal. It is uploaded to the server once a stable connection is established.
In the table a list of days with the following columns is shown:
- Timestamp;
- parameters Ld, Le, Ln, Lden;
- Details (Click on Day view to open day view for the chosen day).
⚠ Daily indicator for the current time of day is recalculated each minute – after the data is uploaded to the server. E.g. Le is recalculated for the last time when the data for minute 21:59 is uploaded to the server. After that the value of Le doesn’t change any more.
Day View
To open Day view click on Day. Data for the day selected in the date field is shown. If data for the selected day exists, it is shown in the table below.
If no data is shown, it means that there is no data for the selected day on the Noise Guard server.

In the table a list of hours with the following columns are shown:
- Timestamp;
- LAeq (This parameter is widely used. It represents a constant noise level with the equivalent energy the measured noise level had in a certain time period.);
- Threshold (Shows the difference from Sound threshold (Set on the second step of editing a terminal.). If the difference from sound threshold is negative (hourly LAeq is under the limit value), there is a green dot next to it. If the sound threshold is exceeded, a red dot is displayed.);
- Details (Click on Hour view to open hour view for the chosen hour).
If you click on a row, the row is highlighted. The selected hour is also highlighted in the graph showing hourly LAeq[dB] values. It also works the other way around: if you click on an hour in the graph, the corresponding row is highlighted.
⚠ To generate an csv file with data from the table click on in the upper right corner.
⚠ You can navigate the table/graph by scrolling/swiping and clicking/tapping. On a computer, you can also use and arrows on your keyboard for navigation.
Hour View
To open hour view, click on HOUR. Select the time in the time selection field next to the date selection field. Data for the chosen date and hour is shown. If data exists, it is shown in the table below.
⚠ If no data is shown, it means that there is no data for the selected hour on the Noise Guard server.
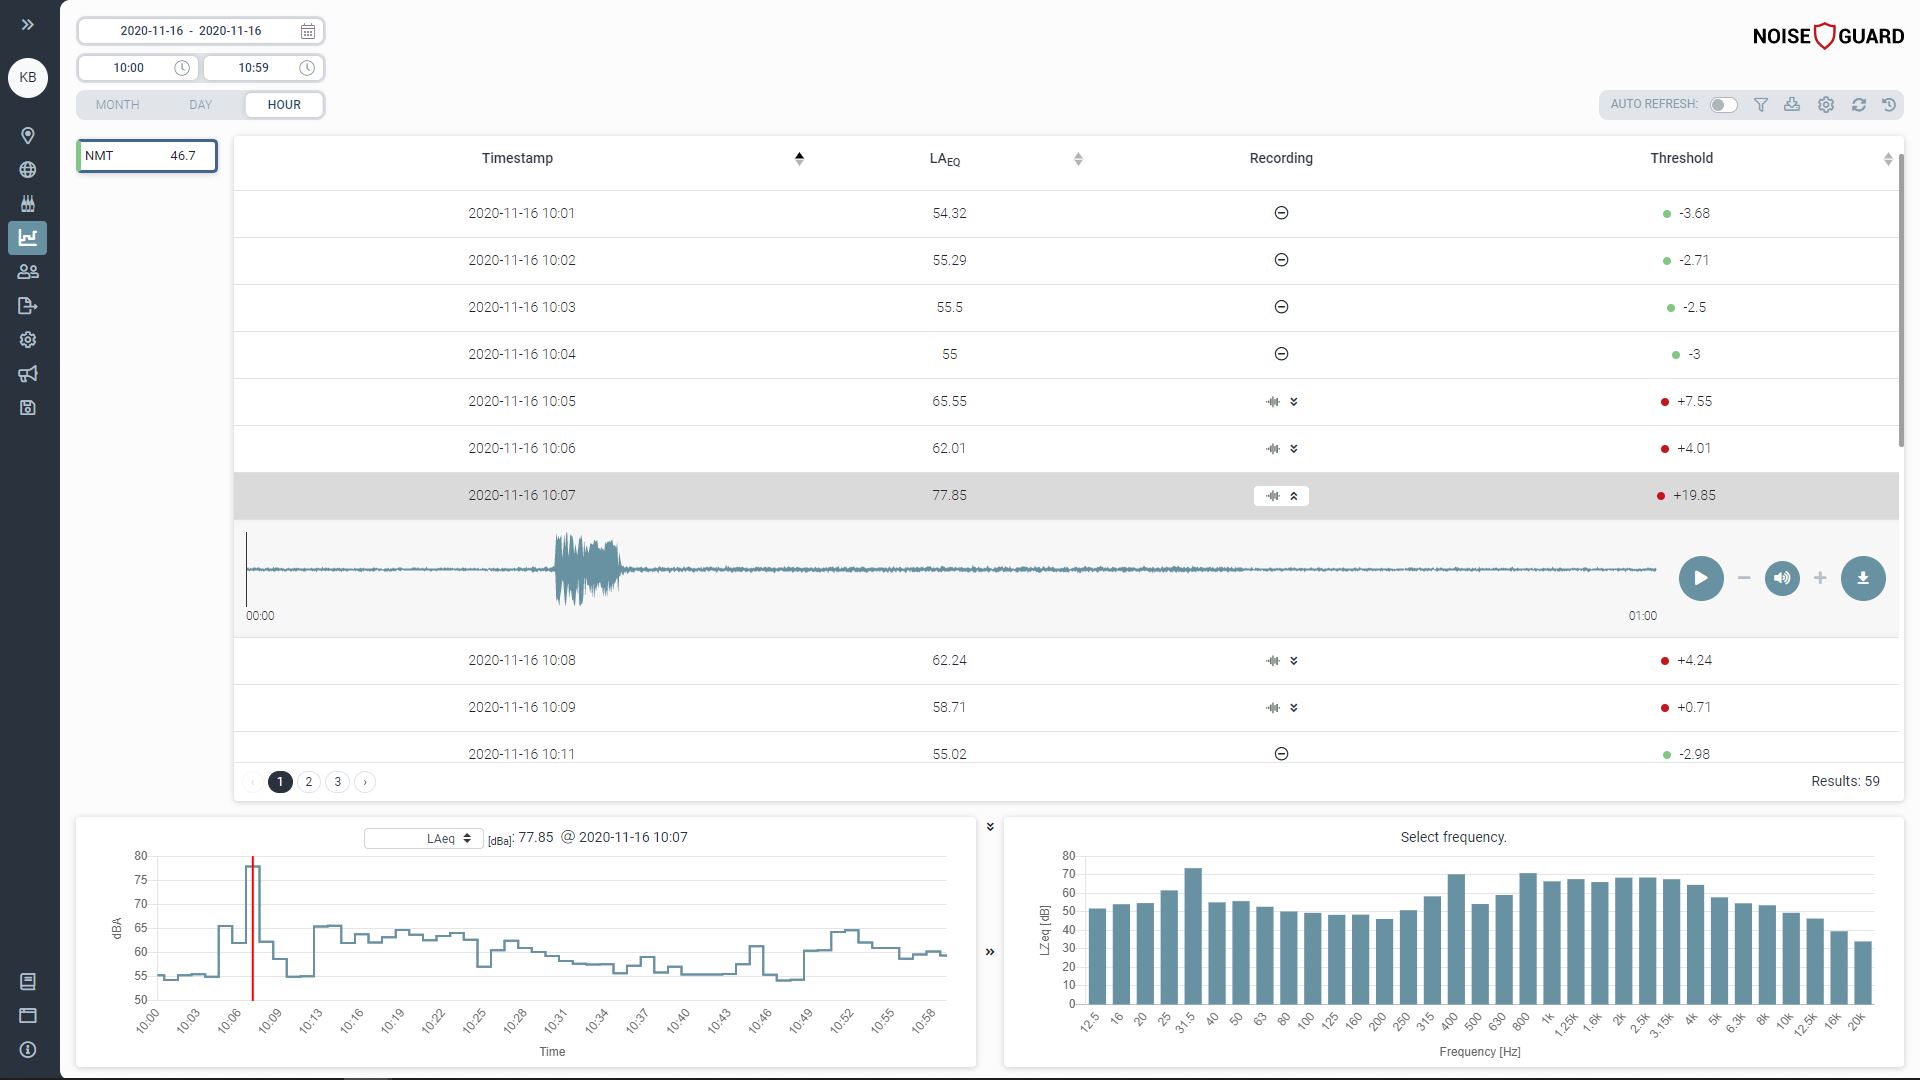
In the table a list of minutes for the chosen hour with the following columns is shown:
- Timestamp;
- LAeq (This parameter is widely used. It represents a constant noise level with the equivalent energy the measured noise level had in a certain time period.);
- Recording;
- Threshold;
An icon indicates that there is no recording for the selected minute.
To listen to the recording, click . Controls for playback and a download button are shown. To hide the recording, click .
⚠ In the spectrum view you can select different frequency weightings: A, C or Z.
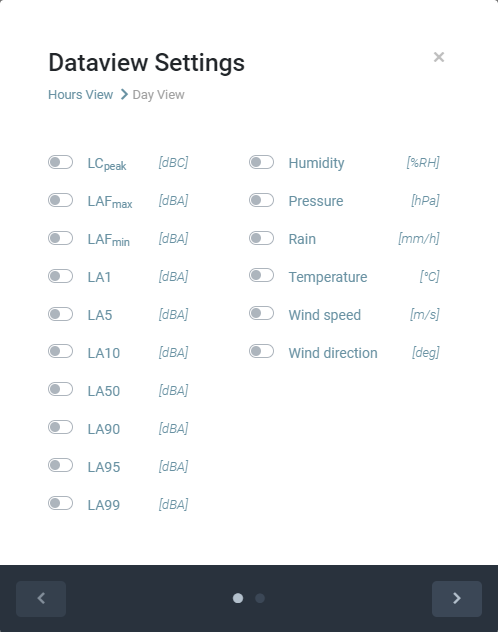
Dataview settings
⚠ Display of additional parameters can be toggled by opening Dataview Settings. Click on the in the upper right corner. The display of parameters can be set for Hours View and Day View separately. To navigate between the settings for the two views use the left and right arrow at the bottom. Click SAVE to save the changes, click to close the Dataview Settings window and discard the changes.
For measurement of the following parameters the optional weather station is needed: Humidity, Pressure, Rain, Temperature, Wind speed, Wind direction.
Explanation of some of the optional parameters:
- LCpeak[dBC] (Frequency weighting that represents human ear sensitivity at levels exceeding 90 dB.);
- LA10 [dBA] (A-weighted level that was exceeded 10 % of the measurement interval.);
- LA90 [dBA] (A-weighted level that was exceeded 90 % of the measurement interval. It can be in some cases used to estimate background noise).